


- University
- Academic
- Schools/Vocational Schools
- Vocational School of Justice
- Vocational School
- Vocational School
- Department of Banking and Insurance (Turkish)
- Department of Computer Programming (Turkish)
- Department of Foreign Trade (Turkish)
- Department of Graphic Design (Turkish)
- Department of Interior Design (Turkish)
- Department of Construction Technology (Turkish)
- Department of Occupational Health and Safety (Turkish)
- Department of Media and Communication (Turkish)
- Department of Architectural Restoration (Turkish)
- Department of Radio and Tv Programming (Turkish)
- Department of Civil Aviation Cabin Services (Turkish)
- Department of Civil Aviation Transportation Management (Turkish)
- Department of Tourism and Hotel Management (Turkish)
- Department of Applied English Translation
- Vocational School Of Health Services
- Vocational School Of Health Services
- Department of Child Development (Turkish)
- Department of Physiotherapy (Turkish)
- Department of Paramedic (Turkish)
- Department of Opticianry (Turkish)
- Department of Medical Documentation and Secreteriat (Turkish)
- Department of Medical Imaging Techniques (Turkish)
- Department of Medical Laboratory Techniques (Turkish)
- Department of Elderly Care (Turkish)
- School of Applied Management Sciences
- School of Foreign Languages
- Faculties
- Faculty of Arts and Sciences
- Faculty of Fine Arts and Design
- Faculty of Law
- Faculty of Communication
- Faculty of Business
- Faculty of Engineering
- Faculty of Engineering
- Department of Computer Engineering
- Department of Biomedical Engineering
- Department of Electrical and Electronics Engineering
- Department of Industrial Engineering
- Department of Food Engineering
- Department of Genetics and Bioengineering
- Department of Aerospace Engineering
- Department of Civil Engineering
- Department of Mechanical Engineering
- Department of Mechatronics Engineering
- Department of Software Engineering
- Faculty of Health Sciences
- Medicine
- Graduate School
- Common Courses
- Schools/Vocational Schools
- Research
- Research Centers
- Library
- Smart Campus
- Technology Transfer Office
- İzmir Sciencepark
- Continuous Education Center (EKOSEM)
- Children's University
- Ethics Committee
- Teaching and Learning Center (EKOEĞİTİM)
- Psychology Application and Research Center
- Researcher Training Coordinatorship
- Research Collaborations And Innovation Coordinatorship
- Campus
- INTERNATIONAL
- Contact
Department of Mathematics
MATH 425 | Course Introduction and Application Information
| Course Name |
Mathematical Computing and Simulation I
|
|
Code
|
Semester
|
Theory
(hour/week) |
Application/Lab
(hour/week) |
Local Credits
|
ECTS
|
|
MATH 425
|
Fall/Spring
|
3
|
0
|
3
|
6
|
| Prerequisites |
None
|
|||||
| Course Language |
English
|
|||||
| Course Type |
Elective
|
|||||
| Course Level |
First Cycle
|
|||||
| Mode of Delivery | face to face | |||||
| Teaching Methods and Techniques of the Course | Problem SolvingLecture / Presentation | |||||
| National Occupation Classification | - | |||||
| Course Coordinator | ||||||
| Course Lecturer(s) | ||||||
| Assistant(s) | ||||||
| Course Objectives | This course aim is to provide the students with the basics of mathematical computing and simulation. Various simulation techniques and numerical methods are discussed in the framework of this course. |
| Learning Outcomes |
The students who succeeded in this course;
|
| Course Description | In this course, the concepts of different computational methods are discussed. Student solve equations numerically and constract plots. As the application to probability theory and statistics, different simulation tethniques are studied. |
| Related Sustainable Development Goals |
|
|
|
Core Courses | |
| Major Area Courses | ||
| Supportive Courses |
X
|
|
| Media and Management Skills Courses | ||
| Transferable Skill Courses |
WEEKLY SUBJECTS AND RELATED PREPARATION STUDIES
| Week | Subjects | Related Preparation |
| 1 | Intro to Data Analysis, Data Scientist's Toolbox, Setup (Colab, IPython). Introduction to Google Colab, Markdown cells, and basic IPython shortcuts. | Python Data Science Handbook (PDSH), Jake VanderPlas. (2016). O′Reilly Media Inc. ISBN: 9781098121211 (Ch-1) |
| 2 | Data Structures in Python, Functions, and Libraries. NumPy Arrays: The foundation of data structures. Python lists vs. NumPy arrays. | Python Data Science Handbook (PDSH), Jake VanderPlas. (2016). O′Reilly Media Inc. ISBN: 9781098121211 (Ch-2) |
| 3 | Random Data, Distributions, Data I/O, and Manipulation. Random Data, Distributions, Data I/O, and Manipulation | Python Data Science Handbook (PDSH), Jake VanderPlas. (2016). O′Reilly Media Inc. ISBN: 9781098121211 (Ch-2, Ch-3) |
| 4 | Control Structures, Conditional Statements. Python Logic: if, elif, else, for loops, and list comprehensions. | Python Data Science Handbook (PDSH), Jake VanderPlas. (2016). O′Reilly Media Inc. ISBN: 9781098121211 (Ch-2) |
| 5 | Numerical Descriptive Statistics, Relationships between Variables. Pandas Aggregation: df.describe(), df.mean(), df.corr(), and df.groupby(). | Python Data Science Handbook (PDSH), Jake VanderPlas. (2016). O′Reilly Media Inc. ISBN: 9781098121211 (Ch-3) |
| 6 | Data Visualization: Basic Plotting Systems. Matplotlib: Creating histograms, scatter plots, and line plots in Colab. | Python Data Science Handbook (PDSH), Jake VanderPlas. (2016). O′Reilly Media Inc. ISBN: 9781098121211 (Ch-4) |
| 7 | Advanced Visualization, Tidy Data, and Statistical Graphics. Seaborn: Advanced plotting (the Python equivalent of ggplot2). Heatmaps, Pairplots. | Python Data Science Handbook (PDSH), Jake VanderPlas. (2016). O′Reilly Media Inc. ISBN: 9781098121211 (Ch-4) |
| 8 | Midterm | |
| 9 | Hypothesis Testing: One-Sample Tests. SciPy Stats: stats.ttest_1samp. Understanding p-values in Python. | Python Data Science Handbook (PDSH), Jake VanderPlas. (2016). O′Reilly Media Inc. ISBN: 9781098121211 (Ch-4) |
| 10 | Checking Assumptions & Goodness of Fit. Normality & Variance: stats.shapiro, stats.levene, and stats.chisquare. | Python Data Science Handbook (PDSH), Jake VanderPlas. (2016). O′Reilly Media Inc. ISBN: 9781098121211 (Ch-4, Ch-5) |
| 11 | Simple Linear Regression and Correlation. Scikit-Learn / Statsmodels: Building a linear model and interpreting coefficients. | Python Data Science Handbook (PDSH), Jake VanderPlas. (2016). O′Reilly Media Inc. ISBN: 9781098121211 (Ch-5) |
| 12 | Dynamic Reporting (Notebooks). Google Colab as a Report: Integrating LaTeX formulas, images, and text into a final report. | Python Data Science Handbook (PDSH), Jake VanderPlas. (2016). O′Reilly Media Inc. ISBN: 9781098121211 (Ch-1) |
| 13 | Data Mining & Statistical Learning (Supervised/Unsupervised). Machine Learning: Intro to Scikit-Learn. K-Means (Unsupervised) and Decision Trees (Supervised). | Python Data Science Handbook (PDSH), Jake VanderPlas. (2016). O′Reilly Media Inc. ISBN: 9781098121211 (Ch-4) |
| 14 | Data Mining & Statistical Learning (Supervised/Unsupervised). Machine Learning: Intro to Scikit-Learn. K-Means (Unsupervised) and Decision Trees (Supervised). | Python Data Science Handbook (PDSH), Jake VanderPlas. (2016). O′Reilly Media Inc. ISBN: 9781098121211 (Ch-4) |
| 15 | Semester Review | |
| 16 | Final Exam |
| Course Notes/Textbooks |
|
|
| Suggested Readings/Materials |
2- McKinney, W. (2012). Python for Data Analysis (3rd ed.). O′Reilly Media, Inc. ISBN: 978-1491957660. |
EVALUATION SYSTEM
| Semester Activities | Number | Weigthing |
| Participation | ||
| Laboratory / Application | ||
| Field Work | ||
| Quizzes / Studio Critiques | ||
| Portfolio | ||
| Homework / Assignments | ||
| Presentation / Jury |
1
|
10
|
| Project |
1
|
10
|
| Seminar / Workshop | ||
| Oral Exams | ||
| Midterm |
1
|
30
|
| Final Exam |
1
|
50
|
| Total |
| Weighting of Semester Activities on the Final Grade |
3
|
50
|
| Weighting of End-of-Semester Activities on the Final Grade |
1
|
50
|
| Total |
ECTS / WORKLOAD TABLE
| Semester Activities | Number | Duration (Hours) | Workload |
|---|---|---|---|
| Theoretical Course Hours (Including exam week: 16 x total hours) |
16
|
3
|
48
|
| Laboratory / Application Hours (Including exam week: '.16.' x total hours) |
16
|
0
|
|
| Study Hours Out of Class |
14
|
3
|
42
|
| Field Work |
0
|
||
| Quizzes / Studio Critiques |
0
|
||
| Portfolio |
0
|
||
| Homework / Assignments |
0
|
||
| Presentation / Jury |
1
|
10
|
10
|
| Project |
1
|
10
|
10
|
| Seminar / Workshop |
0
|
||
| Oral Exam |
0
|
||
| Midterms |
1
|
30
|
30
|
| Final Exam |
1
|
40
|
40
|
| Total |
180
|
COURSE LEARNING OUTCOMES AND PROGRAM QUALIFICATIONS RELATIONSHIP
|
#
|
Program Competencies/Outcomes |
* Contribution Level
|
|||||
|
1
|
2
|
3
|
4
|
5
|
|||
| 1 |
To be able to have a grasp of basic mathematics, applied mathematics or theories and applications of statistics. |
-
|
-
|
-
|
-
|
X
|
|
| 2 |
To be able to use advanced theoretical and applied knowledge, interpret and evaluate data, define and analyze problems, develop solutions based on research and proofs by using acquired advanced knowledge and skills within the fields of mathematics or statistics. |
-
|
-
|
X
|
-
|
-
|
|
| 3 |
To be able to apply mathematics or statistics in real life phenomena with interdisciplinary approach and discover their potentials. |
-
|
-
|
X
|
-
|
-
|
|
| 4 |
To be able to evaluate the knowledge and skills acquired at an advanced level in the field with a critical approach and develop positive attitude towards lifelong learning. |
-
|
-
|
-
|
-
|
-
|
|
| 5 |
To be able to share the ideas and solution proposals to problems on issues in the field with professionals, non-professionals. |
-
|
-
|
-
|
-
|
-
|
|
| 6 |
To be able to take responsibility both as a team member or individual in order to solve unexpected complex problems faced within the implementations in the field, planning and managing activities towards the development of subordinates in the framework of a project. |
-
|
-
|
-
|
-
|
-
|
|
| 7 |
To be able to use informatics and communication technologies with at least a minimum level of European Computer Driving License Advanced Level software knowledge. |
-
|
-
|
-
|
X
|
-
|
|
| 8 |
To be able to act in accordance with social, scientific, cultural and ethical values on the stages of gathering, implementation and release of the results of data related to the field. |
-
|
-
|
-
|
-
|
-
|
|
| 9 |
To be able to possess sufficient consciousness about the issues of universality of social rights, social justice, quality, cultural values and also environmental protection, worker's health and security. |
-
|
-
|
-
|
-
|
-
|
|
| 10 |
To be able to connect concrete events and transfer solutions, collect data, analyze and interpret results using scientific methods and having a way of abstract thinking. |
-
|
-
|
-
|
-
|
-
|
|
| 11 |
To be able to collect data in the areas of Mathematics or Statistics and communicate with colleagues in a foreign language. |
-
|
-
|
-
|
-
|
-
|
|
| 12 |
To be able to speak a second foreign language at a medium level of fluency efficiently. |
-
|
-
|
-
|
-
|
-
|
|
| 13 |
To be able to relate the knowledge accumulated throughout the human history to their field of expertise. |
-
|
-
|
-
|
-
|
-
|
|
*1 Lowest, 2 Low, 3 Average, 4 High, 5 Highest


NEWSALL NEWS


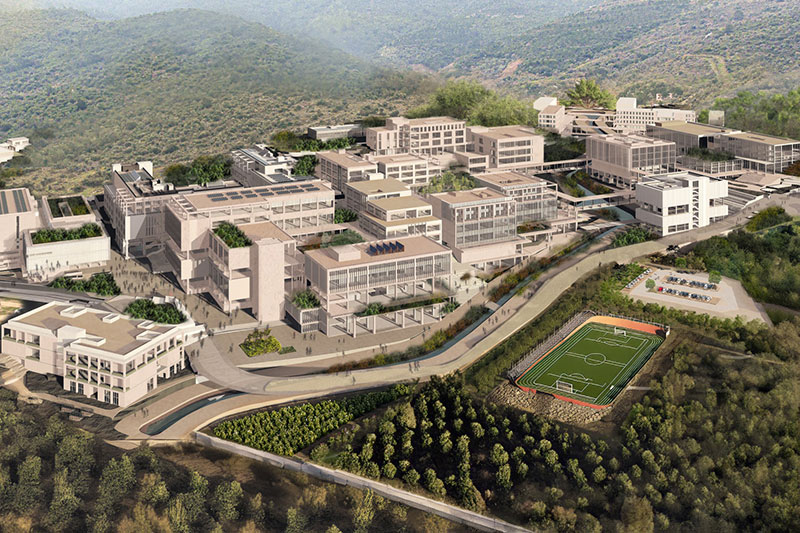
IZMIR UNIVERSITY OF ECONOMICS GÜZELBAHÇE CAMPUS
DetailsGLOBAL CAREER
As Izmir University of Economics transforms into a world-class university, it also raises successful young people with global competence.
More..CONTRIBUTION TO SCIENCE
Izmir University of Economics produces qualified knowledge and competent technologies.
More..VALUING PEOPLE
Izmir University of Economics sees producing social benefit as its reason for existence.
More..
You are one step ahead with your graduate education at Izmir University of Economics.